In a classic Marketing Cloud estate, marketing reporting and revenue reporting live in different buildings. Open rates and clicks in one platform, pipeline and revenue in the CRM, and a monthly reconciliation performed by someone with a spreadsheet and a grievance.
When marketing runs on Salesforce core with Data 360 underneath, that gap largely closes. Engagement and revenue sit on the same platform and can be joined without an export. This is genuinely better — and it raises the stakes, because a number that is easy to produce and visible to everyone had better be defensible.
Key takeaways
- Decide your measurement model before you build campaigns. Retrofitting attribution is expensive and always partial.
- Engagement metrics answer “did the message work.” Only campaign and pipeline data answer “did the marketing work.”
- Open rate is a weak signal and getting weaker. Rebuild reporting around clicks, conversions and pipeline.
- Attribution credibility depends on campaign member data being created automatically and consistently.
- Three dashboards for three audiences beats one dashboard trying to serve everyone.
What the platform records, and what it does not
Start by being clear about the layers, because most reporting confusion is a layer confusion.
| Layer | Examples | Answers |
|---|---|---|
| Engagement | Sends, deliveries, opens, clicks, bounces, unsubscribes | Did this message reach and interest people? |
| Journey and flow | Entries, path taken, waits, exits, goal completion | Is the orchestration doing what we designed? |
| Campaign | Members, statuses, responses, cost | What did this campaign contribute? |
| Pipeline and revenue | Leads, opportunities, amounts, stages, closed won | Did any of it make money? |
| Customer | Lifecycle stage, retention, value, churn | Are we building a better customer base? |
Marketing teams over-report the first layer and under-report the rest, because the first layer arrives for free. The layers that require setup are the ones that answer the questions leadership actually asks.
The open-rate problem
Privacy protections that pre-fetch images inflate opens for a substantial share of recipients, and the affected share varies by audience in ways you cannot see. Any metric derived from opens inherits that distortion — including open-based send-time optimisation, open-based re-engagement triggers and open-based engagement scoring.
The pragmatic response is not to delete the metric but to demote it:
- Keep opens as a directional signal, useful for spotting a deliverability collapse.
- Never use opens as the only input to an automated decision — re-engagement, suppression or scoring.
- Rebuild engagement definitions around clicks, site visits, form submissions and purchases.
- If you report opens to leadership, label them as indicative. Do it once, clearly, rather than defending the number every quarter.
Check your automations for hidden open dependencies
Sunset policies, win-back triggers and engagement scores frequently have an open-based condition buried in them from years ago. Those quietly stopped working as intended. Grep your automation inventory for open-based criteria and re-derive each one before you trust the outputs.
Making attribution defensible
Attribution arguments are almost always data-completeness arguments in disguise. Three mechanics decide whether your model has anything solid to stand on.
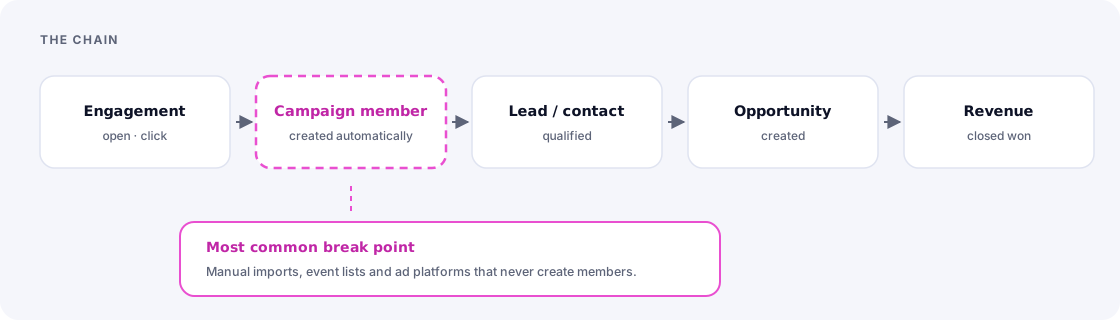
Automatic campaign membership
Every touch that could plausibly influence a deal must create a campaign member record without a human remembering. Form submissions, event attendance, content downloads, ad interactions, webinar registrations. Manual membership creation produces gaps, and gaps make one channel look worse than it is — usually the channel whose owner is least likely to notice.
Consistent member statuses
Standardise statuses across campaign types so that “Responded” means the same thing everywhere. Define them once, document them next to the campaign type, and audit them occasionally. A funnel built on statuses that vary by campaign is arithmetic performed on incomparable things.
A hierarchy that matches the budget
If the business plans by programme and reports by channel, the campaign hierarchy has to roll up both ways. Design it at the start; retrofitting a hierarchy across a year of campaign records is slow, error-prone work that nobody thanks you for.
With those three in place, most organisations find they need only three views: first touch to see what creates demand, last touch before opportunity creation to see what converts it, and full-path influence for deals large enough to justify the analysis. The model rarely limits you. The plumbing does.
Three dashboards for three audiences
One dashboard serving everyone serves no one. Build three, and let each be genuinely small.
Operational — for the marketing team, checked daily
Sends completed and failed, bounce and complaint rates against thresholds, journeys with error states, integration failures, records stuck in a flow, audience counts moving unexpectedly. This dashboard exists to make problems visible within hours rather than at month end. Anything that is not actionable today does not belong on it.
Programme — for marketing leadership, reviewed weekly or monthly
Campaign performance by objective, engagement trend by segment, conversion rates through the funnel stages, cost per outcome where cost data exists, and the disposition feedback from sales. This is where decisions about next month’s plan get made, so every tile should map to a decision someone actually takes.
Executive — for the business, monthly or quarterly
Pipeline sourced and influenced by marketing, revenue attributed, cost per acquisition, retention and customer lifetime value trends. Four to six numbers with trend lines and a written commentary. No open rates.
Write the commentary yourself
A dashboard with no narrative gets interpreted by whoever looks at it first, and their interpretation becomes the organisation’s view. Two paragraphs a month — what moved, why, what we are doing about it — costs almost nothing and controls the story. It is also the fastest way for a marketing function to look like it is in command of its numbers.
Build the measurement plan before the campaigns
The single highest-leverage habit: write a short measurement plan at the start of each programme, before anything is built. Five lines.
- The objective in one sentence, in business terms.
- The primary metric — one, not four — with the number that counts as success.
- Supporting metrics that explain movement in the primary one.
- What has to be instrumented for those metrics to exist: campaign records, statuses, tracking parameters, custom fields.
- When it is reviewed, and who decides what happens next.
Point four is the one that saves the quarter. Discovering after launch that you cannot distinguish this campaign’s contribution from the always-on programme is a mistake that cannot be fixed retrospectively — the data simply does not exist. Ten minutes of instrumentation planning prevents it.
The takeaway
Shared infrastructure removes the excuse that marketing data and revenue data live apart. What it does not remove is the discipline: automatic campaign membership, standard statuses, a hierarchy that matches the budget, a demoted open rate, and a measurement plan written before the build.
Do those five things and marketing reporting stops being a monthly defence and starts being an input to decisions — which is the only version of it worth the effort.
Frequently asked
Seeing this in your own org?
The first call is free: thirty minutes, no slides, and an honest read on what a fix would take. If it is not worth doing, you will hear that too.